#Graphical storytelling
Text
How to Use Graphics in Microlearning to Enhance Learning

Microlearning is a powerful educational strategy that delivers information in small, manageable chunks, making it easier for learners to absorb and retain knowledge. Graphics play a crucial role in enhancing microlearning by making content more engaging, accessible, and memorable. Effective use of graphics can transform complex information into easily digestible visuals, facilitate better understanding, and promote active learning. Here’s a comprehensive guide on how to use graphics in microlearning to enhance learning.
1. Simplify Complex Information
Graphics can simplify complex information, making it easier for learners to understand and remember. When dealing with intricate concepts or data, visual representations like diagrams, charts, and infographics can break down information into more digestible parts.
Infographics: Use infographics to combine text and visuals, providing a clear and concise overview of complex topics. Infographics are particularly effective in presenting data, processes, and comparisons. For instance, an infographic about the benefits of a new software tool can visually highlight its features, advantages, and usage statistics, making the information more accessible and engaging.
Flowcharts: Flowcharts are excellent for illustrating processes and workflows. They provide a step-by-step visual guide that can help learners understand sequences and relationships between different stages of a process. For example, a flowchart showing the steps of a customer service protocol can guide employees through each stage, from initial contact to resolution.
Diagrams and Models: Use diagrams to represent structures, systems, or concepts. For instance, a Venn diagram can effectively illustrate overlapping areas of two related concepts, while a model of a cell can help biology students visualize its components and functions.
2. Enhance Retention and Recall
Graphics enhance retention and recall by leveraging the brain's natural preference for visual information. Visual aids can help learners encode information more effectively, leading to better memory retention.
Mind Maps: Mind maps visually organize information around a central concept, showing the relationships between different ideas. This technique is useful for brainstorming sessions, summarizing lessons, or revising topics. A mind map about a historical event, for example, can connect key dates, figures, and outcomes, helping learners see the big picture and remember details.
Mnemonic Graphics: Use mnemonic graphics to create visual memory aids. Mnemonics are tools that help learners recall information through associations. For example, a graphic that uses the acronym "HOMES" to remember the Great Lakes (Huron, Ontario, Michigan, Erie, Superior) can be a fun and effective learning aid.
Flashcards: Digital flashcards with graphics can enhance vocabulary learning, language acquisition, and other memory-based tasks. Each flashcard can display an image along with a term or definition, making it easier for learners to create mental associations.
3. Engage Learners Actively
Active engagement is crucial for effective learning. Interactive graphics can transform passive learning experiences into active ones, encouraging learners to participate and interact with the content.
Interactive Infographics: Create interactive infographics that learners can explore by clicking on different sections to reveal more information. This approach allows learners to engage with the content at their own pace, diving deeper into areas of interest.
Simulations and Virtual Labs: Use graphics to create simulations and virtual labs that replicate real-world scenarios. These interactive environments enable learners to practice skills and apply knowledge in a safe, controlled setting. For example, a virtual lab for chemistry students can simulate experiments, allowing them to mix chemicals and observe reactions without the risks associated with physical labs.
Clickable Diagrams: Incorporate clickable diagrams that provide additional details when learners hover over or click on specific parts. This technique is useful for exploring detailed systems, such as the human body or machinery, where learners can click on different components to learn more about their functions.
4. Support Diverse Learning Styles
Different learners have different preferences and strengths. Some may be visual learners who benefit greatly from graphics, while others might prefer textual or auditory information. Using a variety of graphics can cater to these diverse learning styles.
Visual Summaries: Provide visual summaries of key points at the end of each microlearning module. These can include bullet points, icons, and illustrations that encapsulate the main ideas. Visual summaries help visual learners quickly grasp the core concepts and serve as a handy reference.
Video Content: Integrate videos with graphical elements such as animations, subtitles, and on-screen text. Videos can combine auditory and visual learning, making them effective for learners who benefit from seeing and hearing information simultaneously. For example, an instructional video on CPR can show animated sequences of the procedure along with audio explanations.
Graphical Storytelling: Use graphics to tell stories that illustrate concepts and scenarios. Storytelling is a powerful tool for making information relatable and memorable. For instance, a graphic story about a company’s journey to achieve sustainability goals can engage learners and provide a narrative context for the information.
5. Facilitate Quick Understanding
In microlearning, time is of the essence. Graphics can convey information quickly and effectively, ensuring that learners grasp the key points without feeling overwhelmed.
Icons and Symbols: Use icons and symbols to represent concepts, actions, and categories. Icons are universally recognized and can quickly convey meaning without the need for lengthy explanations. For example, a series of icons can represent different stages of a project lifecycle, such as planning, execution, and evaluation.
Charts and Graphs: Incorporate charts and graphs to present numerical data and trends. Visualizing data helps learners understand patterns and relationships at a glance. A bar chart showing sales performance across different regions, for example, can quickly highlight areas of success and those needing improvement.
Annotated Images: Use annotated images to highlight and explain specific parts of a visual. An annotated image of a complex machine can label and describe each component, helping learners understand its structure and function quickly.
Best Practices for Using Graphics in Microlearning
To maximize the effectiveness of graphics in microlearning, consider the following best practices:
Keep It Simple: Avoid cluttering your graphics with too much information. Focus on clarity and simplicity to ensure that the visuals are easy to understand.
Consistency: Maintain a consistent style, color scheme, and typography throughout your graphics to create a cohesive learning experience.
Relevance: Ensure that all graphics are directly related to the content and learning objectives. Irrelevant or decorative graphics can distract learners and reduce the effectiveness of the lesson.
Accessibility: Make sure your graphics are accessible to all learners, including those with visual impairments. Use high-contrast colors, alt text for images, and ensure compatibility with screen readers.
Feedback: Gather feedback from learners on the effectiveness of your graphics and make improvements based on their input. Continuous refinement will help you create more effective learning materials.
Conclusion
Graphics are a powerful tool in microlearning, capable of enhancing engagement, simplifying complex information, and supporting diverse learning styles. By integrating well-designed visuals into your microlearning modules, you can create a more effective and enjoyable learning experience. Whether through infographics, interactive elements, or visual summaries, the thoughtful use of graphics can significantly enhance the impact of your microlearning efforts.
#Microlearning#Graphics in education#Visual learning#Infographics#Flowcharts#Diagrams#Interactive content#Learning retention#Active learning#Simplifying complex information#Memory aids#Mnemonic graphics#Digital flashcards#Interactive infographics#Simulations#Virtual labs#Clickable diagrams#Diverse learning styles#Visual summaries#Instructional videos#Graphical storytelling#Quick understanding#Icons and symbols#Charts and graphs#Annotated images#Educational technology#Visual aids#Learning engagement#E-learning#Learning preferences
1 note
·
View note
Text
Me: hm, I want something to put on the TV as background noise... Huh. Looks like YouTube is recommending something called The Last Unicorn. That's perfect, it's probably some old shitty animation that has aged poorly! I can watch it ironically!
Me, 2 hours later as the credits roll: *crying, cheering, buying the book, composing the songs*
Me, 2 weeks later: So I have compiled all of the quotes from the book that I think could make good tattoos, and also, HOW HAVE I NEVER LEARNED ABOUT HOW THE LAST UNICORN FUCKING SLAPS??? This gay-ass little fairytale fed my soul! Watered my crops! Transed my gender! Can't believe I heard of this story from youtube recommendations, of all places!!
#original#the last unicorn#tlu#peter s beagle#molly gru#schmendrick#schmendrick the magician#two of my favorite characters in anything right there in the center of the story! and I'm glad I saw the film first!#my reading ability has diminished due to trauma disability etc. but it seems like having a visual reference actually really helped!#no wonder i only ever want to read fan fic! turns out reading is not actually Superior to other types of Storytelling. it's just different.#to say otherwise is snobbishness I have been eminently guilty of in my life!#but like it is easier for me to consume tv and movies and that is fine actually. also that's why I'm doing a graphic novel lol#because i wanted to make something i would actually be able to read if i found it at a library. altho the audio book IS gonna be bomb#the audiobook is for visually impaired readers and anyone who wants or needs it! accessible stories for everyone! yeah!!#my gender was already transed but now I've gained an ADDITIONAL gender! which one? I'll never tell 😘#i am so powerful i have so much fuckin gender. my wife has no gender. and she is equally as powerful.#and also she has STUDIED THE BLADE#mostly zoro's blades from One Piece#normally YouTube recommends me shit movies like idiocracy or smth this is like if every day ur cat brought you a piece of rotten food and#then one day it brings you a BEAUTIFULLY ANIMATED TALE FEATURING MY BELOVED TWINK FUCK-UP WIZARD FRIEND AND MY ALL-TIME HOMEGIRL MOLLY GRU#and also it's soft and beautiful and funny and fucking weird!! i wrote melodies to the songs in the books on my ukulele
3K notes
·
View notes
Text

oldest trick in the book
#shitpost#barking#ms paint#ms paint comic#comic#short comic#funny comic#storytelling#graphic storytelling
8K notes
·
View notes
Text


𓈒༢ Bell-Ringer & The Storyteller
matching Graphics / requested
rb & credit if using - dividers nf2u⠀⠀⠀ ···
#yarrow the bellringer#yarrow yaelokre#yarrow meadowlark#the storyteller#yaelokre#hayfields#harpy hare#meadowlark#the lark#rentry decor#rentry graphics#rentry inspo#𓈒༢ . . creation 。
400 notes
·
View notes
Text

gals...
#the terror*#fitzier#galfitzier#james fitzjames#francis crozier#been reading a lot of adachi mitsuru and at the same time hadn't drawn in some time so the first two top drawings are like...#very much his style#funny how we are sponges.#also this is a rec. bit old fashioned sometimes but a master of graphic storytelling.#smoking tw
99 notes
·
View notes
Text
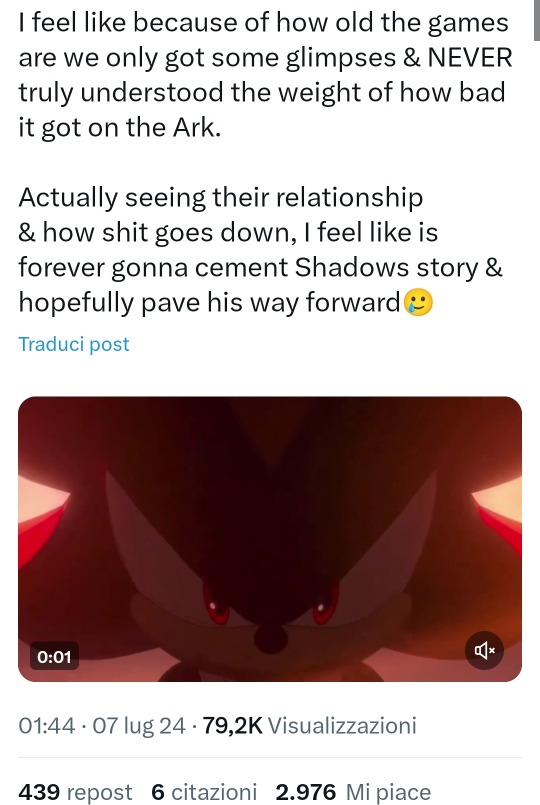
I didn't comment on the short because I found little reason, but this sentiment feels highly disrespectful
I'm not even a huge SA2 fan, but you can't deny that it was leaps and bounds above its predecessor in terms of cinematography and storytelling. I can assure you that everyone understood since the beginning how nightmarish the ARK incident was. If it wasn't because of the sporadic flashbacks Shadow got, or thinga like Lost Colony being shrouded in complete darkness... how about Gerald's diary? Him telling in fear that he's losing his mind? Culminating in the way he turning Shadow into a tool for the sake of his insane revenge?
There was no need for a flashy short to "get" Shadow's past. Its effects on him are visible.
Similarly, ShTH does a pretty good job in showing Shadow and Maria's relationship! In The Doom we see the day of the raid, and Shadow can help Maria rescuing the researchers! Maria mentions running on slopes with him! In Lost Impact Maria asks Shadow for help against Artificial Chaos on the loose! Don't you think it's enough? Did you need to see her caress his cheek as confirmation that they cared about each other?
Shadow's story was already cemented. He already went forward. The short was cool, but aside from adding Emerl into the vision (whether it was real or BD's hallucination we don't know yet), it didn't do anything new that 20 yo games didn't already do.
I don't like this sentiment at all. SXSG will be a nice treat, but it was never necessary for Shadow's character, by far the most fleshed out in the cast precisely due to the heavy lifting of old games like SA2, ShTH and '06.
#sonic the hedgehog#shadow the hedgehog#sonic adventure 2#sonic x shadow generations#nothing against the short either#although i wasn't hyped#but this is the sentiment that leads remakes to be hyped as better than original games#just because they have better graphics or something#i miss more implied/subtle storytelling
45 notes
·
View notes
Text


read all of Inheritance.
#lgbt comics#indie comics#web comics#graphic novel#gay comics#lgbtq webcomic#storytelling#original fiction#original characters#cybersketch
32 notes
·
View notes
Text
so when are we gonna talk about how the costuming for the teens in cobra kai is actually heinous
#IT MAKES NO SENSE#THERES NO CONSISTENCY#like AT ALL#you'd think the characters would have consistent style but eli is just consistently awful!!!!!#same with miguel!!!!!#i could go on a whole rant about tory and sam's outfits#like i know tory has done a lot of growth#but why is her sense of style completely gone#like her edgy sort of looks#her s6 first day of school outfit was like a white denim jacket i said who is this#don't get me started on demetri#the clashing and the patterns it's all awful#graphic tees are v him it's good it's fine but GOD#while we're at it why are we clipping his backpack across his chest#what were we trying to say with that#i just feel like costuming can really enhance characterization and storytelling when done well#and it's so bad that it distracts me honest to god#okay rant over!!!!#cobra kai#ck#cobra kai season 6#ranting
44 notes
·
View notes
Text

🚨"Ares Andresen ARRESTED!"🚨
"Windenburg's most eligible bachelor and heir to the Andresen Corp., Ares Andresen was spotted getting dragged away in handcuffs after allegedly starting a drunken brawl at the Discothèque Pan Europa. This news reaches us amidst rumors of a steamy rendezvous with Elena Bachelor, Simstagram influencer and daughter of pro-athlete Michael Bachelor." -The Windenburg Wire
Publicly disgraced, Ares' mother gave him two options: get married to a respectable woman or be cut off. Ares chose the former, but he has no intention of staying faithful to some random woman.
IB: @largetaytertots & @aashwarr (I wanted to make a magazine cover but my sims aren't classy enough for anything but a gossip rag)
#the sims 4#the sims#the sims community#sims#sims 4 maxis match#sims 4#sims 4 screenshots#ts4 simblr#thesims4#sims4#the sims4#sims 4 simblr#simblr#showusyoursims#ts4 screenshots#sims 4 storytelling#gw: ares#andresen household#graphic design is my passion#i actually spent a ridiculously long time on this
26 notes
·
View notes
Text


#Look! I can edit pictures lol#I figured the images just needed more... OOMPF or something. I got a degree in graphics design ffs#so no idea why I never did this before lmao. But I'll go keep this going for now on!#i mean look at the pretty coilours!#Als my heart breaks for bebe and Ethan...#But she is doing better!#sims 3#the sims 3#ts3#the sims#sims#lisisv#life is sunniest in sunset valley#sims 3 story#sims 3 screenshots#sims 3 gameplay#sims 3 simblr#thesims3#ts3 screenshots#ts3 simblr#sims3#ts3 storytelling#morgana wolff#leighton sekemoto#ethan bunch#bebe hart#nancy landgraab
36 notes
·
View notes
Text

Still in awe over this book- I started reading the single issue comics in junior or senior year of high school (I have a hard time remembering exact years) but then I fell off after 2 issues and wondered for a long time what ever became of that series I liked so much.
And to my amazement it was collected into a single volume book- but lo and behold! It’s expensive and hard to find and no longer in print!
Fast forward several years and I have found a copy of this magnificent book and I read and relive the magic I once felt when I was young. Oh, the joy of it all!
#godzilla reads#Jim Henson’s the Storyteller#dragon books#comic books#graphic novels#book dragon#book Wyrm#dragons#booklr#bookworm#reading#bookish#book blog#Spotify#books and music
34 notes
·
View notes
Text

I'm making good progress with my graphic novel 'Low Tide'. The story is really coming together and I'm excited to see it start to take shape 👀
Main blurb (only draft for now):
Tom's life has always been a quiet one. He was raised by his dad, who died tragically in a boating accident, leaving him to take over the family business and become a fisherman at a young age. Having never left his small English village, Tom works long hours every day, isolated from other people and dedicating his life to his work.
Knowing that Tom lost his father, most of the villagers sympathize with him and recognize him as a hardworking and kind-hearted - yet socially awkward - young man who keeps to himself.
However, one stormy night, Tom's life takes a dramatic turn when he rescues a drowning girl from the sea. This event sets him on a journey that will change his life forever, revealing many dark secrets lurking just beneath the surface of the seemingly quiet village.
#illustration#fan art#ewan mitchell#ewan nation#visual development#aemond#original comic#comic page#graphic novel#indie comics#storytelling#storyboard
114 notes
·
View notes
Text
people love to use ffxiii’s messy development as a reason to completely shit on the game but honestly the fact they managed to sneak in so many little details in the gameplay in a way that reflects the characters and story despite all the miscommunication between the dev sections is just impressive to me
#was xiii horribly planned out and missed out on a lot of important feedback because of the poor time management? absolutely#does that mean you cant be impressed with what the game achieved regardless of whether you liked it or not? fuck no#also the fact theres next to no bugs (not counting the pc port because... yeah) is amazing all things considered#and the graphics still hold up to this day#the linearity is everyones main issue with the game but look at x dude#x was linear as hell too but it makes sense bc yuna had a pilgrimage to follow#just as how it makes sense for the xiii cast to not have time to stop and explore cocoon while they were being hunted by the government#thats why you have so much more freedom to explore when youre on pulse#theres not even anything objectively wrong with having a game be linear in the first place#and the people complaining about the story being ''incoherent'' are just... wrong?#they give you enough hints within the dialogue to piece the story together yourself while also not leaning on exposition dumps to tell it#and if you cant do that then the datalogs are right THERE#games have relied on ''notes'' to tell parts of their story for ages now and i dont understand why its suddenly bad when xiii does it#i dont like sitting through exposition dumps and i like being able to analyse and theorize about a plot WHILE im experiencing it#and a lot of other people feel the same way so its not an objectively bad aspect of the game's storytelling#you just need to pay attention and be patient and wait for the story to unfold#i went off the rails but ANYWAY#aki stfu#final fantasy xiii
83 notes
·
View notes
Text
The Beatles meets JJK
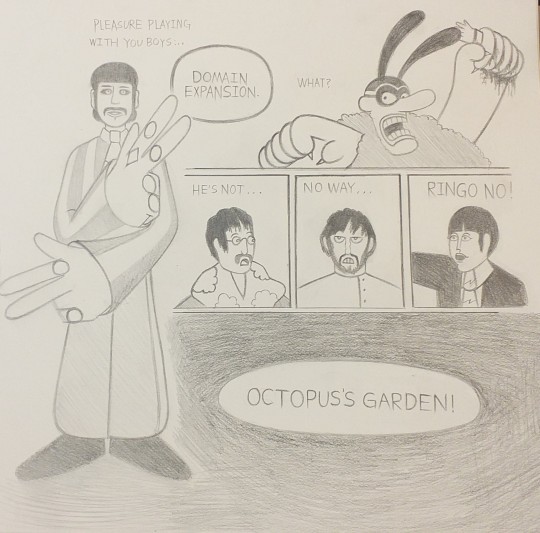
It was originally going to be an actual octopuses garden but I realized I'm bad at drawing octopuses, so pretend his hand is the octupus.
#the beatles#yellow submarine#jujutsu kaisen#jjk#jjk fanart#comic books#comics#art#artists on tumblr#storytelling#graphic novel#character design#graphic design#oc
24 notes
·
View notes
Text
The Nib is no longer going to make new comics and they've put all their PDFs up for free, with an option to make a donation to the archive if you like.
The Nib is an online satire comic created by Matt Bors, who made the "we should improve society somewhat" comic
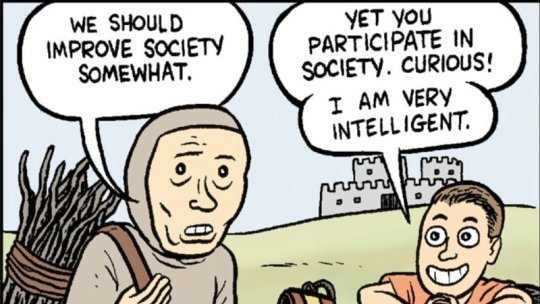
The comics feature a variety of authors telling their stories and making political satire.
#indie comics#comics#free comics#comic books#sequential art#comic art#the nib#thenib#graphic novels#graphic novel#comic book#sequential storytelling#matt bors#the bors comic
57 notes
·
View notes
Text
One of the things I love about Glass Onion is the way that the camera and music work together to tell nonverbal jokes.
Like when Benoit basically has to hold Miles' hand to get him to the conclusion that someone reset the puzzle box Benoit lies about receiving:
Benoit asks if it's possible that someone reset the box, and Miles then declares that someone must have reset the box like it is this huge reveal - and the camera zooms out while the music subtly swells as though he really has figured out something smart, when actually he literally restated what Benoit just said.
#original#I love the reveal that he's not even a smart con artist he's just a piece of shit#he's just a shameless copycat that people keep enabling to do bad things bc they assume he knows what he's talking about bc he's rich#like that line in Fiddler on the Roof - 'it won't matter if I'm wrong or if I'm right cuz you're rich they think you really know!'#glass onion#knives out glass onion#benoit blanc#Daniel Craig#ed norton#I hope the YouTuber sideways does a video about this because he does incredible music theory videos about movie scores#and I bet there are a bunch of hidden meanings within the music that I have no idea how to pick out#that man is like a wizard to me I don't understand how someone can understand music that much!#So cool!#I started this movie like 2 hours ago and I'm barely half an hour in cuz I keep stopping to write film theory essays on Tumblr#oh Adderall you cad!#I have no regrets I feel like this is helping me understand film better. i care a lot about the language of Storytelling#and I must say my favorite medium is film. I am writing a graphic novel right now but if I knew I could just skip that part and make it#into a show. I would do that. I don't wanna draw that much! I like drawing! but I want to see it as a show!!#this is too many drawings!!!!!#but for various reasons the film industry is not really a great place for me - or even possible as a physically disabled person#hard to work yourself up to the director's chair when all the entry positions involve standing for 14 hours at a time#I hope that if I ever do manage to make my graphic novel into a TV show that I will maintain enough control over the project to ensure#accessible hiring practices and workplaces#but in the meantime I guess I have to make waaaay too many drawings#no I can't shorten the story I don't have that kind of control it is an epic saga and the world's longest Slow Burn and that is that
270 notes
·
View notes
Last Seen Blogs

wwwwhaat
mooved... again yes ik i have a problem

predial-cdmx
descargar boleta predial

cincinkawinmakassar
Cincin Kawin Makassar, WA 0852-9902-5552

thefamedblogger
World of Jae

whowouldntlove-blog
hell-bride