#Memory aids
Text
Memory loss is a common challenge faced by individuals dealing with dementia, but there are effective techniques that can help improve cognitive function and enhance overall quality of life. For those receiving home health care in Corona, California, incorporating these strategies into daily routines can make a significant difference.
0 notes
Text
Happy birthday, Duane.

#Duane Kearns Puryear#HIV/AIDS#queer history#AIDS Memorial Quilt#Duane died in 1991#He’d be 59 this year
24K notes
·
View notes
Text
How to Use Graphics in Microlearning to Enhance Learning

Microlearning is a powerful educational strategy that delivers information in small, manageable chunks, making it easier for learners to absorb and retain knowledge. Graphics play a crucial role in enhancing microlearning by making content more engaging, accessible, and memorable. Effective use of graphics can transform complex information into easily digestible visuals, facilitate better understanding, and promote active learning. Here’s a comprehensive guide on how to use graphics in microlearning to enhance learning.
1. Simplify Complex Information
Graphics can simplify complex information, making it easier for learners to understand and remember. When dealing with intricate concepts or data, visual representations like diagrams, charts, and infographics can break down information into more digestible parts.
Infographics: Use infographics to combine text and visuals, providing a clear and concise overview of complex topics. Infographics are particularly effective in presenting data, processes, and comparisons. For instance, an infographic about the benefits of a new software tool can visually highlight its features, advantages, and usage statistics, making the information more accessible and engaging.
Flowcharts: Flowcharts are excellent for illustrating processes and workflows. They provide a step-by-step visual guide that can help learners understand sequences and relationships between different stages of a process. For example, a flowchart showing the steps of a customer service protocol can guide employees through each stage, from initial contact to resolution.
Diagrams and Models: Use diagrams to represent structures, systems, or concepts. For instance, a Venn diagram can effectively illustrate overlapping areas of two related concepts, while a model of a cell can help biology students visualize its components and functions.
2. Enhance Retention and Recall
Graphics enhance retention and recall by leveraging the brain's natural preference for visual information. Visual aids can help learners encode information more effectively, leading to better memory retention.
Mind Maps: Mind maps visually organize information around a central concept, showing the relationships between different ideas. This technique is useful for brainstorming sessions, summarizing lessons, or revising topics. A mind map about a historical event, for example, can connect key dates, figures, and outcomes, helping learners see the big picture and remember details.
Mnemonic Graphics: Use mnemonic graphics to create visual memory aids. Mnemonics are tools that help learners recall information through associations. For example, a graphic that uses the acronym "HOMES" to remember the Great Lakes (Huron, Ontario, Michigan, Erie, Superior) can be a fun and effective learning aid.
Flashcards: Digital flashcards with graphics can enhance vocabulary learning, language acquisition, and other memory-based tasks. Each flashcard can display an image along with a term or definition, making it easier for learners to create mental associations.
3. Engage Learners Actively
Active engagement is crucial for effective learning. Interactive graphics can transform passive learning experiences into active ones, encouraging learners to participate and interact with the content.
Interactive Infographics: Create interactive infographics that learners can explore by clicking on different sections to reveal more information. This approach allows learners to engage with the content at their own pace, diving deeper into areas of interest.
Simulations and Virtual Labs: Use graphics to create simulations and virtual labs that replicate real-world scenarios. These interactive environments enable learners to practice skills and apply knowledge in a safe, controlled setting. For example, a virtual lab for chemistry students can simulate experiments, allowing them to mix chemicals and observe reactions without the risks associated with physical labs.
Clickable Diagrams: Incorporate clickable diagrams that provide additional details when learners hover over or click on specific parts. This technique is useful for exploring detailed systems, such as the human body or machinery, where learners can click on different components to learn more about their functions.
4. Support Diverse Learning Styles
Different learners have different preferences and strengths. Some may be visual learners who benefit greatly from graphics, while others might prefer textual or auditory information. Using a variety of graphics can cater to these diverse learning styles.
Visual Summaries: Provide visual summaries of key points at the end of each microlearning module. These can include bullet points, icons, and illustrations that encapsulate the main ideas. Visual summaries help visual learners quickly grasp the core concepts and serve as a handy reference.
Video Content: Integrate videos with graphical elements such as animations, subtitles, and on-screen text. Videos can combine auditory and visual learning, making them effective for learners who benefit from seeing and hearing information simultaneously. For example, an instructional video on CPR can show animated sequences of the procedure along with audio explanations.
Graphical Storytelling: Use graphics to tell stories that illustrate concepts and scenarios. Storytelling is a powerful tool for making information relatable and memorable. For instance, a graphic story about a company’s journey to achieve sustainability goals can engage learners and provide a narrative context for the information.
5. Facilitate Quick Understanding
In microlearning, time is of the essence. Graphics can convey information quickly and effectively, ensuring that learners grasp the key points without feeling overwhelmed.
Icons and Symbols: Use icons and symbols to represent concepts, actions, and categories. Icons are universally recognized and can quickly convey meaning without the need for lengthy explanations. For example, a series of icons can represent different stages of a project lifecycle, such as planning, execution, and evaluation.
Charts and Graphs: Incorporate charts and graphs to present numerical data and trends. Visualizing data helps learners understand patterns and relationships at a glance. A bar chart showing sales performance across different regions, for example, can quickly highlight areas of success and those needing improvement.
Annotated Images: Use annotated images to highlight and explain specific parts of a visual. An annotated image of a complex machine can label and describe each component, helping learners understand its structure and function quickly.
Best Practices for Using Graphics in Microlearning
To maximize the effectiveness of graphics in microlearning, consider the following best practices:
Keep It Simple: Avoid cluttering your graphics with too much information. Focus on clarity and simplicity to ensure that the visuals are easy to understand.
Consistency: Maintain a consistent style, color scheme, and typography throughout your graphics to create a cohesive learning experience.
Relevance: Ensure that all graphics are directly related to the content and learning objectives. Irrelevant or decorative graphics can distract learners and reduce the effectiveness of the lesson.
Accessibility: Make sure your graphics are accessible to all learners, including those with visual impairments. Use high-contrast colors, alt text for images, and ensure compatibility with screen readers.
Feedback: Gather feedback from learners on the effectiveness of your graphics and make improvements based on their input. Continuous refinement will help you create more effective learning materials.
Conclusion
Graphics are a powerful tool in microlearning, capable of enhancing engagement, simplifying complex information, and supporting diverse learning styles. By integrating well-designed visuals into your microlearning modules, you can create a more effective and enjoyable learning experience. Whether through infographics, interactive elements, or visual summaries, the thoughtful use of graphics can significantly enhance the impact of your microlearning efforts.
#Microlearning#Graphics in education#Visual learning#Infographics#Flowcharts#Diagrams#Interactive content#Learning retention#Active learning#Simplifying complex information#Memory aids#Mnemonic graphics#Digital flashcards#Interactive infographics#Simulations#Virtual labs#Clickable diagrams#Diverse learning styles#Visual summaries#Instructional videos#Graphical storytelling#Quick understanding#Icons and symbols#Charts and graphs#Annotated images#Educational technology#Visual aids#Learning engagement#E-learning#Learning preferences
1 note
·
View note
Text
First Printed edition of "One of the earliest printed books on the ars memorativa or mnemotechnics" . . ca.1480
502J Petrus de Rosenheim. (1380-1432). Nom probable : Petrus Wiechs
[incipt Roseum memoriale divinorum eloquiorum] /
[Köln] : [Southern Germany : n.pr., about 1480-90?] or [Cologne? : n.pr., about 1483] or [Ludwig von Renchen?], 1483 Deutschland (Oberrhein?). $13,000
Quarto (21 x 15 cm). ( a-f8 ) [1-68]. [48] a1 blank and lacking. Text in one column, 32 lines. Type: 80G. Initials…

View On WordPress
1 note
·
View note
Text
A safe home environment is crucial for the well-being of dementia patients. People with dementia often experience cognitive decline and memory issues that increase the risk of unwanted incidents and accidents at home.
0 notes
Text
(Another) Ghost in the Machine
DP x Hellblazer (the original John Constantine comic)
Ritchie Simpson continued to search frantically for the connection out of the computer and back to his body as he begged John to explain what he meant by saying “Goodbye.”
Had John disconnected him? He knew John’s sense of humor wasn’t the lightest, especially after Newcastle drove them all a bit insane, but that felt too far even for him. Nah, he’d probably just gotten himself a bit lost in the wave of energy he’d experienced in the Tongues of Fire network and was accidentally looking for his body in the wrong spot.
He pulled himself back and let his mental connection to the digital world expand outward, probing the rest of the machine for the connection. He knew he was in the right system, so as long as he looked thoroughly he’d definitely fi—
Everything flashed a surge of blinding white and then was replaced by pure darkness. He thought he screamed, but he couldn’t hear his own voice. Couldn’t even feel his own thoughts. Trapped in one single instant that stretched for indeterminable eons. Then, eventually (or was it immediately?), awareness began to trickle back.
He was still in the computer, though it felt… different, somehow. His thoughts still weren’t entirely in order. The first possible hints towards his location he found were the sound voices trickling through from the outside world. Voices he didn’t recognize. Young voices.
“I’m happy to help, Tuck, but I’m not really sure what you expect me to do here. You’re way better than me at this computer stuff than me.”
“By all means, feel free to keep complimenting me, but this has been frying my brain, man. I got this thing secondhand, and the system should be quite powerful, but there’s something using up a ton of its processing and I can’t figure out what. I was hoping you could do your ‘enter into the computer’ thing and see if you see anything.”
#okay so for people who don’t know what’s going on with the DC side:#in John Constantine: Hellblazer there’s this old friend of Constantine called Richie who uses “quantum magic” to inteface with computers#and Constantine asks him to find the base of the Resurrection Crusaders (a religious group that’s an antagonist of that part of the comic)#which he does do. but while looking into the Tongues of Fire subgroup he encounters a thing of energy that burns his body to a crisp#but his mind is still in the computer unaware of that#and constantine doesn’t know how to explain that to him so he just… doesn’t.#and unplugs the machine as like a mercy kill ish thing#in the comic he sorta survived in the network for a time longer#but instead this idea was more like he was trapped in the memory banks of the computer#which eventually made its way into Tucker’s hands and led to him and Team Phantom meeting#he’d probably count as a ghost but the situation would certainly be unusual for both sides#dp x dc#dpxdc#dc x dp#dcxdp#danny phantom x dc#danny phantom x dc crossover#dp x hellblazer#dpxdc john constantine#dp x dc prompt#dpxdc prompt#dc x dp prompt#dcxdp prompt#oh also. just gonna kinda sidestep how he helped Constantine out later in the original. I guess John worked something else out this time.#or maybe that event could be delayed so Ritchie can still show up (perhaps with Team Phantom’s aid too though…)
149 notes
·
View notes
Text
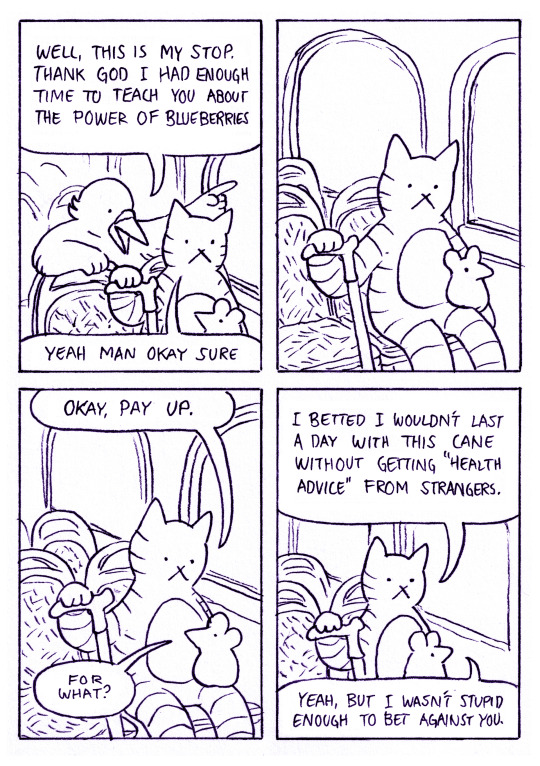
[Image description by @needacupoftea : a short lineart comic by externalmemorycomic featuring a cat and a mouse.
Panel one shows the cat and mouse sitting on a train or bus. The cat has a cane. The mouse is in the cat's lap. A bird leans over the cat, pointing out the window.
Bird: Well, this is my stop. Thank god I had enough time to teach you about the power of blueberries
Cat: Yeah man okay sure
End panel.
Panel two shows the cat and mouse sitting silently.
End panel.
Panel three shows the cat and mouse looking at each other.
Cat: Okay, pay up.
Mouse: For what?
End panel.
Panel four shows the cat looking at the mouse, while the mouse has looked away out the window.
Cat: I betted I wouldn't last a day with this cane without getting "health advice" from strangers.
Mouse: Yeah, but I wasn't stupid enough to bet against you. End panel.
End ID.]
(I have a Patreon! For just 3€/3.50$ a month YOU get daily updates of this comic and WE get money for bills and food, which fuels me to make even more comics!!! So far I’ve posted 150 comics to my Patreon already - check out the link in my pinned post if you like :D)
#disability#ableism#mobility aid#cane user#comic#comics#original comic#web comic#webcomic#diary comic#slice of life#autobiographical comics#journal comics#comic artists on tumblr#external memory comic#slice of life comic
1K notes
·
View notes
Text
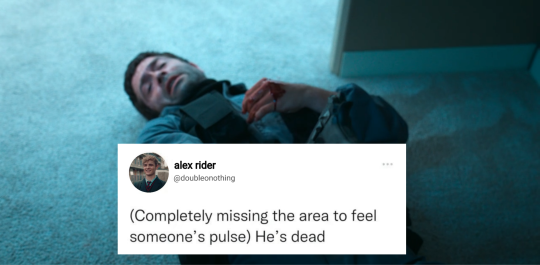
alex has no medical knowledge
#this is the screenshot i was trying to take btw lmaoo#as per my last post#because i wanted to make this shitpost#i spent legitimately like 45 minutes trying to edit this#from my memory though alex does not have any sort of first aid training so this is 100% book accurate#alex rider#yassen gregorovich
272 notes
·
View notes
Text

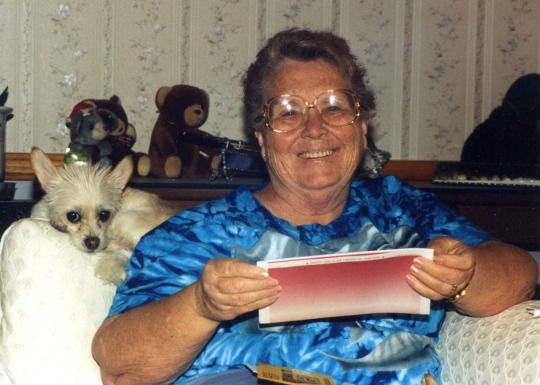
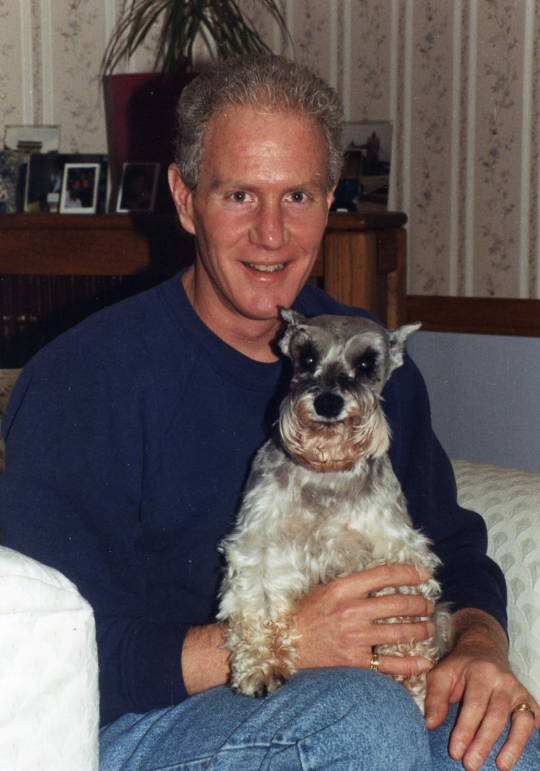
#90s nostalgia#nostalgia#2000s nostalgia#childhood#90s#2000s childhood#2000s kid#nostalgic#childhood memories#2000s#my childhood#images from my childhood#90s childhood#00s nostalgia#kool aid#childhood snacks#food nostalgia
544 notes
·
View notes
Text
On World AIDS Day, I remember my aunt Billie June and my cousin Roy. Technically my cousin died of starvation after he decided he couldn't cope any longer with several years of AIDS symptoms, and she died of a stroke from grief, but it was AIDS killed them. I love and miss both of them.
208 notes
·
View notes
Text
i love that roy cohn is part of the AIDS quilt. “bully. coward. victim” is so powerful and does a really good job of succinctly acknowledging how damaging such a restrictive environment is and how that allowed someone like cohn to hold so much internalized homophobia that he spent his career outing other queer ppl
#fellow travelers#roy cohn#aids memorial#the first time i saw his square those three words hit me like a punch in the gut#and this is obviously not to excuse what he did. but you have to understand the context#he truly thought there was no other way for him to live#horrifying for everyone. even the ones with the supposed power
163 notes
·
View notes
Text

#hiv/aids#aids#aids crisis#aidsday2022#aids activism#aids history#hiv#queer history#respectability politics#lgbtq history#radical inclusivity#radical acceptance#radical red#radical feminism#radical self love#radical feminists please touch#radical queer#radical history#radical eco thug spared jail after pouring poo on memorial to captain tom moore#rights
783 notes
·
View notes
Note
I just made a huge pot of pasta so can you draw her with spaghetti hair

Day 93: Spagteki and meatballs
#guys you better be responsible with her if I see people eating her hair istg-#also I gave her a little hearing aid I don’t remember where I got that from but yea#your turn to die#yttd dailies#daily teki#yttd memory dance girl#yttd#teki yttd#yttd daily#yttd art#your turn to die art#teki tsutone#yttd fanart#your turn to die fanart#your turn to daily#your turn to dailies
86 notes
·
View notes
Text


elaboration in the tags
#i like to think that even before the whole dinner shabang#there was a lingering tension in fiddleford and fords relationship#because of fords refusal to elaborate on why he was in poor condition all the time#and fiddleford started to distance himself from him#not only because of the weight with the memory gun and everything else#but also because fiddleford eventually got fed up with ford 'using' him as aid after every possession#obviously ford refuses constant outside help because of his paranoia#and it leaves fiddleford feeling like he isnt helping him enough as is#idk. i just know shit was awkward and they bickered a lot towards the end#fiddleford mcgucket#ford pines#doodles#gravity falls#fanart#art diary
339 notes
·
View notes
Text
The AIDS Memorial Quilt is made up of panels that are 3 ft by 6 ft, which is about the size of a grave. The panels are then sewn together into 12 ft by 12 ft squares, and the entire quilt covers 1.3 million square feet and weighs 54 tons. The size of the panels is meant to represent how much land would be covered if all the people who died from AIDS were lined up head to toe

I saw the AIDS Memorial Quilts exhibit when they came to Ft. Worth in 1993. It was such a powerful & emotional experience that I'll never forget. I still have the shirt from it
30 notes
·
View notes
Text

#plagiarism#james somerton#hbomberguy#just wanted to give it its own post#it was kinda lost under the absolute unit#(of good commentary and a much needed summary of the More Absolute Unit that is the video in question)#of lrb#i was conflicted abt this dude for a while like. i wasn't A Fan Subbed To His Patreon right#but the way he 'said' some really insightful shit and also dropped some really nonsensical rancid comments randomly in the middle of it.#yeah#guess it's because he Wasn't Fucking Saying Anything But The Rancidity Himself HUH?#nomás que eso fuera 😹😹#& like i'm laughing rly hard at the audacity but also it's really fucking sad & infuriating to have had the actual authors of the commentar#that i enjoyed obfuscated like that. and obv not just bc of the individual enjoyment or insight i might've gotten from them but#they were fully robbed of an audience#or just fucking. recognition of their memory in the case of the people whose words were stolen who died from fucking aids#like????#yeah i hope this fully ended this man's whole career for good#but more importantly that the authors of the works he ripped off get the attention they deserve#it's the fucking soulless business major of it all innit#/j#viitalks#gayplagiarismgate
63 notes
·
View notes
Last Seen Blogs

yuuashiya
ashiya

shilohtravelsworld
Untitled


topidea
Untitled

runslikealady
A Girl and Her Sneakers (and Running Skirts)