#big data in science
Explore tagged Tumblr posts
Visit Tumblr Blog
Explore Tumblr blogs with no restrictions, modern design and the best experience.
Last Seen Tumblr Blogs


Fun Fact
In February 2021, Tumblr had 518.6 million blog accounts.
Text
If you're feeling anxious or depressed about the climate and want to do something to help right now, from your bed, for free...
Start helping with citizen science projects
What's a citizen science project? Basically, it's crowdsourced science. In this case, crowdsourced climate science, that you can help with!
You don't need qualifications or any training besides the slideshow at the start of a project. There are a lot of things that humans can do way better than machines can, even with only minimal training, that are vital to science - especially digitizing records and building searchable databases
Like labeling trees in aerial photos so that scientists have better datasets to use for restoration.
Or counting cells in fossilized plants to track the impacts of climate change.
Or digitizing old atmospheric data to help scientists track the warming effects of El Niño.
Or counting penguins to help scientists better protect them.
Those are all on one of the most prominent citizen science platforms, called Zooniverse, but there are a ton of others, too.
Oh, and btw, you don't have to worry about messing up, because several people see each image. Studies show that if you pool the opinions of however many regular people (different by field), it matches the accuracy rate of a trained scientist in the field.
--
I spent a lot of time doing this when I was really badly injured and housebound, and it was so good for me to be able to HELP and DO SOMETHING, even when I was in too much pain to leave my bed. So if you are chronically ill/disabled/for whatever reason can't participate or volunteer for things in person, I highly highly recommend.
Next time you wish you could do something - anything - to help
Remember that actually, you can. And help with some science.
#honestly I've been meaning to make a big fancy thorough post about this for literally over a year now#finally just accepted that's not going to happen#so have this!#there's also a ton of projects in other fields as well btw#including humanities#and participating can be a great way to get experience/build your resume esp if you want to go into the sciences#actual data handling! yay#science#citizen science#climate change#climate crisis#climate action#environment#climate solutions#meterology#global warming#biology#ecology#plants#hope#volunteer#volunteering#disability#actually disabled#data science#archives#digital archives#digitization#ways to help#hopepunk
40K notes
·
View notes
Text
How Big Data Analytics is Changing Scientific Discoveries
Introduction
In the contemporary world of the prevailing sciences and technologies, big data analytics becomes a powerful agent in such a way that scientific discoveries are being orchestrated. At Techtovio, we explore this renewed approach to reshaping research methodologies for better data interpretation and new insights into its hastening process. Read to continue
#CategoriesScience Explained#Tagsastronomy data analytics#big data analytics#big data automation#big data challenges#big data in healthcare#big data in science#big data privacy#climate data analysis#computational data processing#data analysis in research#data-driven science#environmental research#genomics big data#personalized medicine#predictive modeling in research#real-time scientific insights#scientific data integration#scientific discoveries#Technology#Science#business tech#Adobe cloud#Trends#Nvidia Drive#Analysis#Tech news#Science updates#Digital advancements#Tech trends
1 note
·
View note
Text

At the Space Telescope Science Institute, teams supporting the Nancy Grace Roman Space Telescope made incredible progress developing its Science Operations Center, building strong partnerships, and broadening and deepening the engagement of the science community.
Here, Kristen McQuinn, the head of the Roman Mission Office at the institute, and mission scientist Gisella De Rosa introduce the incredibly powerful Roman Research Nexus and why community input is so important:
Kristen McQuinn:Roman will be able to survey large areas of the sky quite rapidly—1,000 times faster than Hubble—with its camera, the Wide Field Instrument. Roman will return a lot of data—too much for researchers to download to their own computers.
Gisella De Rosa:That’s why we built a cloud-based platform known as the Roman Research Nexus. All the data, tools, and software researchers might need are in one online space. It’s where users can also analyze Roman’s data collaboratively with their teams. Roman is a community-focused mission. More than 1,000 scientists have participated in its survey definition, and authored and coauthored science pitches and white papers to clarify how they would like to use this telescope.
Read the full interview: https://www.stsci.edu/contents/annual-reports/2024/centered-on-community
23 notes
·
View notes
Text
The Continents ARE the

This is the only categorization system that you could scrap the data from, make all new observations, and then reproduce again. You get a couple of small continents, a couple of underwater ones... It's a "8 planets and 5 dwarf planets" situation and a bonanza for the trivia game industry in one!
"But what about Europe!" I hear you shout in a vague attempt at peer review.
Henceforth, all arbitrary sociopolitical regions (like "Europe") will be designated as Zones.
We don't use the word zone enough. Think how much hearing "You are now entering the European Zone" come over the intercom after a long plane journey would greatly enhance the experience of international travel.
Go ahead, say it out loud. "Zone."
Feels good.
Feels right.
Zone.
#big shoutout to our friends in New Zealand#or the above water portion of the Aotearoan continent#melinoe laboratories#unreality#but it shouldn't be#tectonic plates#science#repeatable data#continents
120 notes
·
View notes
Text
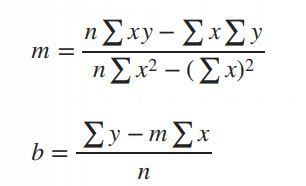
Simple Linear Regression in Data Science and machine learning
Simple linear regression is one of the most important techniques in data science and machine learning. It is the foundation of many statistical and machine learning models. Even though it is simple, its concepts are widely applicable in predicting outcomes and understanding relationships between variables.
This article will help you learn about:
1. What is simple linear regression and why it matters.
2. The step-by-step intuition behind it.
3. The math of finding slope() and intercept().
4. Simple linear regression coding using Python.
5. A practical real-world implementation.
If you are new to data science or machine learning, don’t worry! We will keep things simple so that you can follow along without any problems.
What is simple linear regression?
Simple linear regression is a method to model the relationship between two variables:
1. Independent variable (X): The input, also called the predictor or feature.
2. Dependent Variable (Y): The output or target value we want to predict.
The main purpose of simple linear regression is to find a straight line (called the regression line) that best fits the data. This line minimizes the error between the actual and predicted values.
The mathematical equation for the line is:
Y = mX + b
: The predicted values.
: The slope of the line (how steep it is).
: The intercept (the value of when).
Why use simple linear regression?
click here to read more https://datacienceatoz.blogspot.com/2025/01/simple-linear-regression-in-data.html
#artificial intelligence#bigdata#books#machine learning#machinelearning#programming#python#science#skills#big data#linear algebra#linear b#slope#interception
6 notes
·
View notes
Text
Apparently today is international cat day!


I'd like to paint or sculpt more cats. But probably not ~100 at once, as in the 2nd artwork.
1. crop of: https://www.olenashmahalo.com/project/animals-2023 2. crops of: https://www.olenashmahalo.com/project/herding-data
#cats#SciArt#ScienceIllustration#NoAI#natureintheory#olena shmahalo#science illustration#illustration#art#portfolio#cat art#digital painting#human art#human artists#No AI#CSP#ragdoll cat#neuroscience#big data
17 notes
·
View notes
Photo
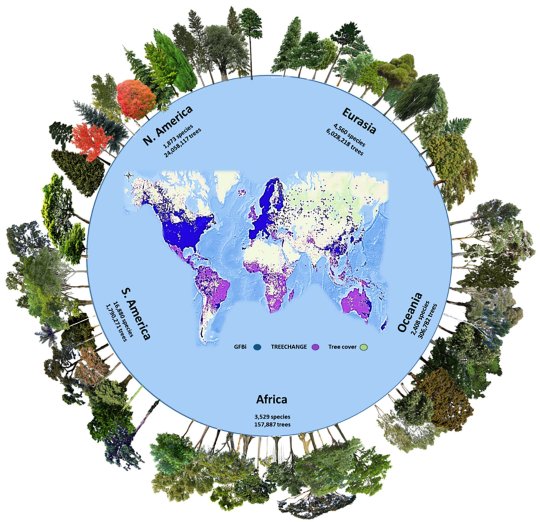
Diagram showing the number of tree species and the estimated tree population of the world in 2022.
“The number of tree species and individuals per continent in the Global Forest Biodiversity Initiative (GFBI) database. This dataset (blue points in the central map) was used for the parametric estimation and merged with the TREECHANGE occurrence-based data (purple points in the central map) to provide the estimates in this study. Green areas represent the global tree cover. GFBI consists of abundance-based records of 38 million trees for 28,192 species. Depicted here are some of the most frequent species recorded in each continent. Some GFBI and TREECHANGE points may overlap in the map. Image credit: Gatti et al., doi: 10.1073/pnas.2115329119.“
Source: Tom Kimmerer’s Twitter page
#scientific diagram#trees#forestcore#botany#katia plant scientist#rainforest#taiga#woodland#forests#Forest#tree cover#nature#science#ecology#natural history#diagram#infographic#big data#biology#plant biology#bioinformatics#science news
108 notes
·
View notes
Text
another day, another opportunity to thank past me for dropping out of that damn phd program
#the ppl who stayed in research are getting their funding pulled#the ppl who are transitioning to data science are having a hard time finding jobs bc there aren’t a lot of entry level positions#i left in 2022 when data science was hiring like crazy and had just enough experience during the big crash of 24 to not fair too badly#the only ppl doing ok are the ones who went into pharm research and I don’t wanna help pad big pharma’s pockets lmao#shoutout to quitting. we love quitting ❤️#m.txt
2 notes
·
View notes
Text
as a young afab queer person going into computer/data science, it makes me so sad that the face of the tech industry is a largely misogynistic homophobic transphobic trump-suck-up unethical billionaire bro club like musk, bezos, and zuckerberg. like, computers and the internet have limitless potential, but we’re using it for this????
i cannot wait until all these dipshits get what’s coming to them so a new generation of leaders can rise up and make tech kind.
#rant post#politics#leftist#leftism#anti capitalism#socialism#queer#lgbt pride#fuck trump#technology#big tech#computer science#computer scientist#programming#data science#data scientist#big data#data ethics#tech ethics#fuck billionaires#gen z#feminist#internet#eat the rich
4 notes
·
View notes
Text
Exploring Data Science Tools: My Adventures with Python, R, and More
Welcome to my data science journey! In this blog post, I'm excited to take you on a captivating adventure through the world of data science tools. We'll explore the significance of choosing the right tools and how they've shaped my path in this thrilling field.
Choosing the right tools in data science is akin to a chef selecting the finest ingredients for a culinary masterpiece. Each tool has its unique flavor and purpose, and understanding their nuances is key to becoming a proficient data scientist.
I. The Quest for the Right Tool
My journey began with confusion and curiosity. The world of data science tools was vast and intimidating. I questioned which programming language would be my trusted companion on this expedition. The importance of selecting the right tool soon became evident.
I embarked on a research quest, delving deep into the features and capabilities of various tools. Python and R emerged as the frontrunners, each with its strengths and applications. These two contenders became the focus of my data science adventures.
II. Python: The Swiss Army Knife of Data Science
Python, often hailed as the Swiss Army Knife of data science, stood out for its versatility and widespread popularity. Its extensive library ecosystem, including NumPy for numerical computing, pandas for data manipulation, and Matplotlib for data visualization, made it a compelling choice.
My first experiences with Python were both thrilling and challenging. I dove into coding, faced syntax errors, and wrestled with data structures. But with each obstacle, I discovered new capabilities and expanded my skill set.
III. R: The Statistical Powerhouse
In the world of statistics, R shines as a powerhouse. Its statistical packages like dplyr for data manipulation and ggplot2 for data visualization are renowned for their efficacy. As I ventured into R, I found myself immersed in a world of statistical analysis and data exploration.
My journey with R included memorable encounters with data sets, where I unearthed hidden insights and crafted beautiful visualizations. The statistical prowess of R truly left an indelible mark on my data science adventure.
IV. Beyond Python and R: Exploring Specialized Tools
While Python and R were my primary companions, I couldn't resist exploring specialized tools and programming languages that catered to specific niches in data science. These tools offered unique features and advantages that added depth to my skill set.
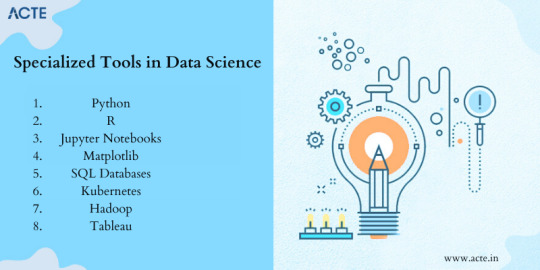
For instance, tools like SQL allowed me to delve into database management and querying, while Scala opened doors to big data analytics. Each tool found its place in my toolkit, serving as a valuable asset in different scenarios.
V. The Learning Curve: Challenges and Rewards
The path I took wasn't without its share of difficulties. Learning Python, R, and specialized tools presented a steep learning curve. Debugging code, grasping complex algorithms, and troubleshooting errors were all part of the process.
However, these challenges brought about incredible rewards. With persistence and dedication, I overcame obstacles, gained a profound understanding of data science, and felt a growing sense of achievement and empowerment.
VI. Leveraging Python and R Together
One of the most exciting revelations in my journey was discovering the synergy between Python and R. These two languages, once considered competitors, complemented each other beautifully.
I began integrating Python and R seamlessly into my data science workflow. Python's data manipulation capabilities combined with R's statistical prowess proved to be a winning combination. Together, they enabled me to tackle diverse data science tasks effectively.
VII. Tips for Beginners
For fellow data science enthusiasts beginning their own journeys, I offer some valuable tips:
Embrace curiosity and stay open to learning.
Work on practical projects while engaging in frequent coding practice.
Explore data science courses and resources to enhance your skills.
Seek guidance from mentors and engage with the data science community.
Remember that the journey is continuous—there's always more to learn and discover.
My adventures with Python, R, and various data science tools have been transformative. I've learned that choosing the right tool for the job is crucial, but versatility and adaptability are equally important traits for a data scientist.
As I summarize my expedition, I emphasize the significance of selecting tools that align with your project requirements and objectives. Each tool has a unique role to play, and mastering them unlocks endless possibilities in the world of data science.
I encourage you to embark on your own tool exploration journey in data science. Embrace the challenges, relish the rewards, and remember that the adventure is ongoing. May your path in data science be as exhilarating and fulfilling as mine has been.
Happy data exploring!
22 notes
·
View notes
Text
Database gives insights into language loss
A new global database of grammatical features in different languages also gives us new insights into the consequences of language loss.
The first study to use the new database—called Grambank—shows that grammatical diversity is decreasing in the areas of the world in which languages are most endangered.
You can explore the database yourself here!
An incredible book about what types of grammatical diversity are lost when languages stop being spoken is When languages die:

18 notes
·
View notes
Text
What are some challenging concepts for beginners learning data science, such as statistics and machine learning?
Hi,
For beginners in data science, several concepts can be challenging due to their complexity and depth.
Here are some of the most common challenging concepts in statistics and machine learning:

Statistics:
Probability Distributions: Understanding different probability distributions (e.g., normal, binomial, Poisson) and their properties can be difficult. Knowing when and how to apply each distribution requires a deep understanding of their characteristics and applications.
Hypothesis Testing: Hypothesis testing involves formulating null and alternative hypotheses, selecting appropriate tests (e.g., t-tests, chi-square tests), and interpreting p-values. The concepts of statistical significance and Type I/Type II errors can be complex and require careful consideration.
Confidence Intervals: Calculating and interpreting confidence intervals for estimates involves understanding the trade-offs between precision and reliability. Beginners often struggle with the concept of confidence intervals and their implications for statistical inference.
Regression Analysis: Multiple regression analysis, including understanding coefficients, multicollinearity, and model assumptions, can be challenging. Interpreting regression results and diagnosing issues such as heteroscedasticity and autocorrelation require a solid grasp of statistical principles.
Machine Learning:
Bias-Variance Tradeoff: Balancing bias and variance to achieve a model that generalizes well to new data can be challenging. Understanding overfitting and underfitting, and how to use techniques like cross-validation to address these issues, requires careful analysis.
Feature Selection and Engineering: Selecting the most relevant features and engineering new ones can significantly impact model performance. Beginners often find it challenging to determine which features are important and how to transform raw data into useful features.
Algorithm Selection and Tuning: Choosing the appropriate machine learning algorithm for a given problem and tuning its hyperparameters can be complex. Each algorithm has its own strengths, limitations, and parameters that need to be optimized.
Model Evaluation Metrics: Understanding and selecting the right evaluation metrics (e.g., accuracy, precision, recall, F1 score) for different types of models and problems can be challenging.
Advanced Topics:
Deep Learning: Concepts such as neural networks, activation functions, backpropagation, and hyperparameter tuning in deep learning can be intricate. Understanding how deep learning models work and how to optimize them requires a solid foundation in both theoretical and practical aspects.
Dimensionality Reduction: Techniques like Principal Component Analysis (PCA) and t-Distributed Stochastic Neighbor Embedding (t-SNE) for reducing the number of features while retaining essential information can be difficult to grasp and apply effectively.
To overcome these challenges, beginners should focus on building a strong foundation in fundamental concepts through practical exercises, online courses, and hands-on projects. Seeking clarification from mentors or peers and engaging in data science communities can also provide valuable support and insights.
#bootcamp#data science course#datascience#data analytics#machinelearning#big data#ai#data privacy#python
3 notes
·
View notes
Text
From Beginner to Pro: A Game-Changing Big Data Analytics Course
Are you fascinated by the vast potential of big data analytics? Do you want to unlock its power and become a proficient professional in this rapidly evolving field? Look no further! In this article, we will take you on a journey to traverse the path from being a beginner to becoming a pro in big data analytics. We will guide you through a game-changing course designed to provide you with the necessary information and education to master the art of analyzing and deriving valuable insights from large and complex data sets.

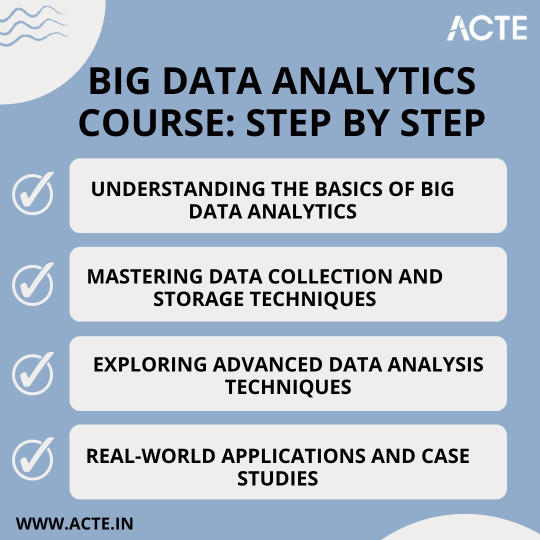
Step 1: Understanding the Basics of Big Data Analytics
Before diving into the intricacies of big data analytics, it is crucial to grasp its fundamental concepts and methodologies. A solid foundation in the basics will empower you to navigate through the complexities of this domain with confidence. In this initial phase of the course, you will learn:
The definition and characteristics of big data
The importance and impact of big data analytics in various industries
The key components and architecture of a big data analytics system
The different types of data and their relevance in analytics
The ethical considerations and challenges associated with big data analytics
By comprehending these key concepts, you will be equipped with the essential knowledge needed to kickstart your journey towards proficiency.
Step 2: Mastering Data Collection and Storage Techniques
Once you have a firm grasp on the basics, it's time to dive deeper and explore the art of collecting and storing big data effectively. In this phase of the course, you will delve into:
Data acquisition strategies, including batch processing and real-time streaming
Techniques for data cleansing, preprocessing, and transformation to ensure data quality and consistency
Storage technologies, such as Hadoop Distributed File System (HDFS) and NoSQL databases, and their suitability for different types of data
Understanding data governance, privacy, and security measures to handle sensitive data in compliance with regulations
By honing these skills, you will be well-prepared to handle large and diverse data sets efficiently, which is a crucial step towards becoming a pro in big data analytics.
Step 3: Exploring Advanced Data Analysis Techniques
Now that you have developed a solid foundation and acquired the necessary skills for data collection and storage, it's time to unleash the power of advanced data analysis techniques. In this phase of the course, you will dive into:
Statistical analysis methods, including hypothesis testing, regression analysis, and cluster analysis, to uncover patterns and relationships within data
Machine learning algorithms, such as decision trees, random forests, and neural networks, for predictive modeling and pattern recognition
Natural Language Processing (NLP) techniques to analyze and derive insights from unstructured text data
Data visualization techniques, ranging from basic charts to interactive dashboards, to effectively communicate data-driven insights
By mastering these advanced techniques, you will be able to extract meaningful insights and actionable recommendations from complex data sets, transforming you into a true big data analytics professional.
Step 4: Real-world Applications and Case Studies
To solidify your learning and gain practical experience, it is crucial to apply your newfound knowledge in real-world scenarios. In this final phase of the course, you will:
Explore various industry-specific case studies, showcasing how big data analytics has revolutionized sectors like healthcare, finance, marketing, and cybersecurity
Work on hands-on projects, where you will solve data-driven problems by applying the techniques and methodologies learned throughout the course
Collaborate with peers and industry experts through interactive discussions and forums to exchange insights and best practices
Stay updated with the latest trends and advancements in big data analytics, ensuring your knowledge remains up-to-date in this rapidly evolving field
By immersing yourself in practical applications and real-world challenges, you will not only gain valuable experience but also hone your problem-solving skills, making you a well-rounded big data analytics professional.
Through a comprehensive and game-changing course at ACTE institute, you can gain the necessary information and education to navigate the complexities of this field. By understanding the basics, mastering data collection and storage techniques, exploring advanced data analysis methods, and applying your knowledge in real-world scenarios, you have transformed into a proficient professional capable of extracting valuable insights from big data.
Remember, the world of big data analytics is ever-evolving, with new challenges and opportunities emerging each day. Stay curious, seek continuous learning, and embrace the exciting journey ahead as you unlock the limitless potential of big data analytics.
17 notes
·
View notes
Text
2 notes
·
View notes
Text
Beginner’s Guide to Ridge Regression in Machine Learning
Introduction
Regression analysis is a fundamental technique in machine learning, used to predict a dependent variable based on one or more independent variables. However, traditional regression methods, such as simple linear regression, can struggle to deal with multicollinearity (high correlation between predictors). This is where ridge regression comes in handy.
Ridge regression is an advanced form of linear regression that reduces overfitting by adding a penalty term to the model. In this article, we will cover what ridge regression is, why it is important, how it works, its assumptions, and how to implement it using Python.
What is Ridge Regression?
Ridge regression is a type of regularization technique that modifies the linear
click here to read more
https://datacienceatoz.blogspot.com/2025/02/a-beginners-guide-to-ridge-regression.html
#artificial intelligence#bigdata#books#machine learning#machinelearning#programming#python#science#skills#big data
4 notes
·
View notes
Text
*leaves a comment on every single chapter of a fic as I read it* *author replies to every single comment with increasing giddiness and excitement*
This is good. I’m getting a good grade in fic reader. This is both something that is normal to want and possible to achieve.
#ra speaks#personal#fanfiction#fanfic#ao3#archive of our own#I’m not going to lie: then replying incentivizes me to keep commenting#and like I get it Big Fics make it unrealistic for an author to reply to every comment#but boy that email gives me the same dopamine rush as the emails abt ppl leaving comments on MY fics#who gives a shit of ‘oh but I don’t want to inflate my comment count - ‘ shut up and let me kiss you. with tongue.#or bake you your favorite kind of muffin if it’s best we keep this professional/platonic#in other news: o7 survived my first day as a TA. I have class in a few hours for my data science course and it probably won’t kill me.#probably.
10 notes
·
View notes