#Data Scientist
Explore tagged Tumblr posts
Visit Tumblr Blog
Explore Tumblr blogs with no restrictions, modern design and the best experience.
Last Seen Tumblr Blogs


Fun Fact
Tumblr was the first site to host the blog for President Barack Obama in 2011.
Text

Hey! and welcome back!
As Uni is about to begin in a few days....I upgraded to a third monitor! Also!! I job a Data entry job! Big things moving forward :)
Let me introduce myself;
I'm Mick, (she/her) and I currently study Data Analytics. I'll be 26 in July and I love to read and play video games in my free time. I also like to watch football (LIVERPOOL xx)
Im currently taking the time to learn Excel and Python. However, I know for school I'll be learning Python, SQL and maybe some other things.
FOLLOW me along on this journey and if you have any questions please ask!
#codeblr#python#coding#data analytics#study blog#study motivation#studyblr#student life#excel#student#physics#maths#pc setup#data analysis#data entry work#data entry projects#data scientist#study aesthetic
29 notes
·
View notes
Text
I have exams for the next week and I missed this blog I hope to get some studying done


~ ✿
#student life#study#uni student#university#exams#exam week#data science#data scientist#first year#uni life#study motivation#desi studyblr#study blog#studyblr#studyblr community#flowers#pretty flowers#animal crossing#study aesthetic#studying#cats#cat cafe
36 notes
·
View notes
Text


Hi! I'm ally, this is my studyblr blog.
INTJ 5w4 584 mel-chol sx/so LVEF
Im currently studying Data Science, but besides coding I also enjoy cybersecurity, poetry, literature, universal history, philosophy, psychiatry, neurology, sociology, astronomy, feminism, music, typology, jung, enneagram languages and anarchism.
Gonna use this blog for rant, motivation, quotes, pretty pictures of my study sessions and pretty pictures and info that I found comforting here.
If I have any mistake on english let me know, because my mother language is spanish. So if u r spanish speaker let's be friends pls!!
I'm 18 years old. She-her from Lima, Peru. And + I also enjoy rock and alt music, goth and punk subculture, aesthetics, fashion and lolita fashion, writing, comics, anime and memes.
Girlblog @girlpresidentt and personal acc @allinson @dollpparts, blog that I don't use but my @ is really cool @cryptidacademia

Dividers made by @dollywons
#moruteacademia#morute academia#coquette academia#gloomy coquette#gloomy academia#cryptidcore#cryptid coquette#cryptidcore morute#dark academia#stem academia#stemblr#chaotic academia#chaotic studyblr#study blog#studyblr#morute#goth academia#horror academia#just a girlblog#study aesthetic#academic weapon#pink academia#girly academia#light academia#romantic academia#coding#code princess#data scientist#data science#women in stem
35 notes
·
View notes
Text
as a young afab queer person going into computer/data science, it makes me so sad that the face of the tech industry is a largely misogynistic homophobic transphobic trump-suck-up unethical billionaire bro club like musk, bezos, and zuckerberg. like, computers and the internet have limitless potential, but we’re using it for this????
i cannot wait until all these dipshits get what’s coming to them so a new generation of leaders can rise up and make tech kind.
#rant post#politics#leftist#leftism#anti capitalism#socialism#queer#lgbt pride#fuck trump#technology#big tech#computer science#computer scientist#programming#data science#data scientist#big data#data ethics#tech ethics#fuck billionaires#gen z#feminist#internet#eat the rich
5 notes
·
View notes
Text
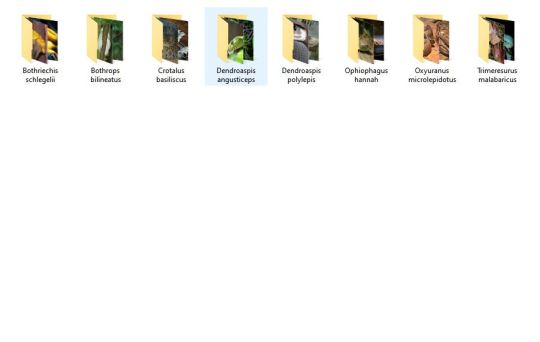
Tonight I am hunting down venomous and nonvenomous snake pictures that are under the creative commons of specific breeds in order to create one of the most advanced, in depth datasets of different venomous and nonvenomous snakes as well as a test set that will include snakes from both sides of all species. I love snakes a lot and really, all reptiles. It is definitely tedious work, as I have to make sure each picture is cleared before I can use it (ethically), but I am making a lot of progress! I have species such as the King Cobra, Inland Taipan, and Eyelash Pit Viper among just a few! Wikimedia Commons has been a huge help!
I'm super excited.
Hope your nights are going good. I am still not feeling good but jamming + virtual snake hunting is keeping me busy!
#programming#data science#data scientist#data analysis#neural networks#image processing#artificial intelligence#machine learning#snakes#snake#reptiles#reptile#herpetology#animals#biology#science#programming project#dataset#kaggle#coding
43 notes
·
View notes
Text
Cross Fox
The cross Fox is a partially melanistic colour variant of the Vulpes vulpes (red fox)
It is rarer than the common red form but it is more common than the silver fox.


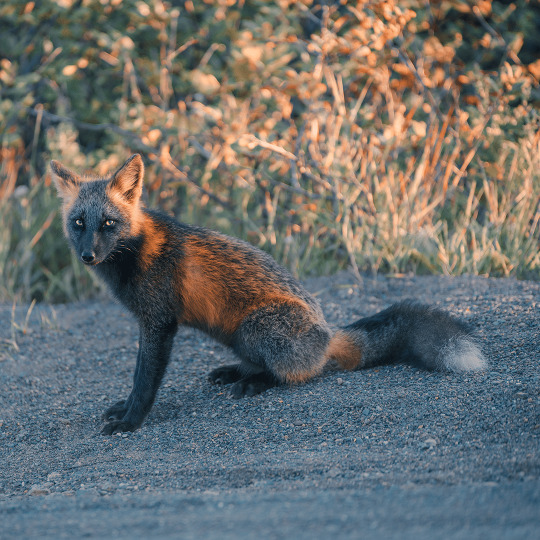

The cross fox derives its name from the vertical dark band running down the back, which is intersected with another horizontal band across the shoulders.
They are relatively common in the northern areas of North America. They also comprise up to 30% of the red fox population in Canada.
#interesting#interesting facts#biology#go viral#nature#animals#aesthetic#fox#photoshoot#nature photography#photography#photooftheday#halloween#viral#science facts#science#data scientist#wildlife#wild animals#rarity
36 notes
·
View notes
Text
youtube
#statistics#mathematics#mathblr#math art#calculated risk#calculator#calculus#calculations#cat#black cat#cats#cute cats#kitty cat#cats of tumblr#catblr#kittens#kitten#kitty#kittyposting#cute kitty#natural science#science#mad scientist#data scientist#scientific illustration#research scientist#stem#stem student#stem academia#stemblr
14 notes
·
View notes
Text
#bungou stray dogs#dogs of tumblr#bungou gay dogs#bungo stray dogs fanart#dogs#dog man#dogblr#dog#science#pro science#the glass scientists#mad scientist#data scientist#research scientist#scientist#class war#ausgov#politas#auspol#tasgov#taspol#australia#fuck neoliberals#neoliberal capitalism#anthony albanese#albanese government#anti apple#anti capitalism#antifascist#antifaschistische aktion
18 notes
·
View notes
Text
HT @dataelixir
13 notes
·
View notes
Text

[ID: Crayon style drawing of a light brown mouse wearing a button down shirt, a black blazer, and glasses. She holds a tablet with various types of charts in her paw. /end ID]
I was listening to a pre-recorded meeting at work and wanted to keep my hands busy, so I created this game! Dress a mouse girl data scientist in formal button downs or relaxed grafic t-shirts, and finish the look with one of 19 different charts and data visualizations for her tablet. There’s bar charts, line charts, pie charts, scatter plots, table data, and much more!
Mouse Girl Data Scientist Dress Up
19 notes
·
View notes
Text
Here is the video I made to discuss the book I made to screw with AI
As much as I wanted to describe the book with valor, I had to stop every so often to not make it an angry rant
I hope you like it!
youtube
#content#content creator#content creation#ai#not ai#anti ai#generative ai#ai art#rant#personal#personal post#book#youtube#youtuber#my video#my art#my books#frustrated#discussion#computer scientist#data scientist#prompt engineering#Youtube
4 notes
·
View notes
Text
Understanding Outliers in Machine Learning and Data Science

In machine learning and data science, an outlier is like a misfit in a dataset. It's a data point that stands out significantly from the rest of the data. Sometimes, these outliers are errors, while other times, they reveal something truly interesting about the data. Either way, handling outliers is a crucial step in the data preprocessing stage. If left unchecked, they can skew your analysis and even mess up your machine learning models.
In this article, we will dive into:
1. What outliers are and why they matter.
2. How to detect and remove outliers using the Interquartile Range (IQR) method.
3. Using the Z-score method for outlier detection and removal.
4. How the Percentile Method and Winsorization techniques can help handle outliers.
This guide will explain each method in simple terms with Python code examples so that even beginners can follow along.
1. What Are Outliers?
An outlier is a data point that lies far outside the range of most other values in your dataset. For example, in a list of incomes, most people might earn between $30,000 and $70,000, but someone earning $5,000,000 would be an outlier.
Why Are Outliers Important?
Outliers can be problematic or insightful:
Problematic Outliers: Errors in data entry, sensor faults, or sampling issues.
Insightful Outliers: They might indicate fraud, unusual trends, or new patterns.
Types of Outliers
1. Univariate Outliers: These are extreme values in a single variable.
Example: A temperature of 300°F in a dataset about room temperatures.
2. Multivariate Outliers: These involve unusual combinations of values in multiple variables.
Example: A person with an unusually high income but a very low age.
3. Contextual Outliers: These depend on the context.
Example: A high temperature in winter might be an outlier, but not in summer.
2. Outlier Detection and Removal Using the IQR Method
The Interquartile Range (IQR) method is one of the simplest ways to detect outliers. It works by identifying the middle 50% of your data and marking anything that falls far outside this range as an outlier.
Steps:
1. Calculate the 25th percentile (Q1) and 75th percentile (Q3) of your data.
2. Compute the IQR:
{IQR} = Q3 - Q1
Q1 - 1.5 \times \text{IQR}
Q3 + 1.5 \times \text{IQR} ] 4. Anything below the lower bound or above the upper bound is an outlier.
Python Example:
import pandas as pd
# Sample dataset
data = {'Values': [12, 14, 18, 22, 25, 28, 32, 95, 100]}
df = pd.DataFrame(data)
# Calculate Q1, Q3, and IQR
Q1 = df['Values'].quantile(0.25)
Q3 = df['Values'].quantile(0.75)
IQR = Q3 - Q1
# Define the bounds
lower_bound = Q1 - 1.5 * IQR
upper_bound = Q3 + 1.5 * IQR
# Identify and remove outliers
outliers = df[(df['Values'] < lower_bound) | (df['Values'] > upper_bound)]
print("Outliers:\n", outliers)
filtered_data = df[(df['Values'] >= lower_bound) & (df['Values'] <= upper_bound)]
print("Filtered Data:\n", filtered_data)
Key Points:
The IQR method is great for univariate datasets.
It works well when the data isn’t skewed or heavily distributed.
3. Outlier Detection and Removal Using the Z-Score Method
The Z-score method measures how far a data point is from the mean, in terms of standard deviations. If a Z-score is greater than a certain threshold (commonly 3 or -3), it is considered an outlier.
Formula:
Z = \frac{(X - \mu)}{\sigma}
is the data point,
is the mean of the dataset,
is the standard deviation.
Python Example:
import numpy as np
# Sample dataset
data = {'Values': [12, 14, 18, 22, 25, 28, 32, 95, 100]}
df = pd.DataFrame(data)
# Calculate mean and standard deviation
mean = df['Values'].mean()
std_dev = df['Values'].std()
# Compute Z-scores
df['Z-Score'] = (df['Values'] - mean) / std_dev
# Identify and remove outliers
threshold = 3
outliers = df[(df['Z-Score'] > threshold) | (df['Z-Score'] < -threshold)]
print("Outliers:\n", outliers)
filtered_data = df[(df['Z-Score'] <= threshold) & (df['Z-Score'] >= -threshold)]
print("Filtered Data:\n", filtered_data)
Key Points:
The Z-score method assumes the data follows a normal distribution.
It may not work well with skewed datasets.
4. Outlier Detection Using the Percentile Method and Winsorization
Percentile Method:
In the percentile method, we define a lower percentile (e.g., 1st percentile) and an upper percentile (e.g., 99th percentile). Any value outside this range is treated as an outlier.
Winsorization:
Winsorization is a technique where outliers are not removed but replaced with the nearest acceptable value.
Python Example:
from scipy.stats.mstats import winsorize
import numpy as np
Sample data
data = [12, 14, 18, 22, 25, 28, 32, 95, 100]
Calculate percentiles
lower_percentile = np.percentile(data, 1)
upper_percentile = np.percentile(data, 99)
Identify outliers
outliers = [x for x in data if x < lower_percentile or x > upper_percentile]
print("Outliers:", outliers)
# Apply Winsorization
winsorized_data = winsorize(data, limits=[0.01, 0.01])
print("Winsorized Data:", list(winsorized_data))
Key Points:
Percentile and Winsorization methods are useful for skewed data.
Winsorization is preferred when data integrity must be preserved.
Final Thoughts
Outliers can be tricky, but understanding how to detect and handle them is a key skill in machine learning and data science. Whether you use the IQR method, Z-score, or Wins
orization, always tailor your approach to the specific dataset you’re working with.
By mastering these techniques, you’ll be able to clean your data effectively and improve the accuracy of your models.
#science#skills#programming#bigdata#books#machinelearning#artificial intelligence#python#machine learning#data centers#outliers#big data#data analysis#data analytics#data scientist#database#datascience#data
4 notes
·
View notes
Text

final sem exam has started and so have my longer study sessions, I have recently started studying with these pomodoro videos and they have been very helpful for me.
PomodoroCrew is the channel and their videos are awesome (╹▽╹)
~✿
#data science#data scientist#exams#student life#study#study blog#study motivation#studyblr#studyblr community#studying#pomodoro#study method#uni life#university life#uniblr#uni student#university#university student#college studyblr#computer science#study inspo#realistic studyblr#student#study aesthetic#study space#motivation#coding#lavender
20 notes
·
View notes
Text
instagram
Hey there! 🚀 Becoming a data analyst is an awesome journey! Here’s a roadmap for you:
1. Start with the Basics 📚:
- Dive into the basics of data analysis and statistics. 📊
- Platforms like Learnbay (Data Analytics Certification Program For Non-Tech Professionals), Edx, and Intellipaat offer fantastic courses. Check them out! 🎓
2. Master Excel 📈:
- Excel is your best friend! Learn to crunch numbers and create killer spreadsheets. 📊🔢
3. Get Hands-on with Tools 🛠️:
- Familiarize yourself with data analysis tools like SQL, Python, and R. Pluralsight has some great courses to level up your skills! 🐍📊
4. Data Visualization 📊:
- Learn to tell a story with your data. Tools like Tableau and Power BI can be game-changers! 📈📉
5. Build a Solid Foundation 🏗️:
- Understand databases, data cleaning, and data wrangling. It’s the backbone of effective analysis! 💪🔍
6. Machine Learning Basics 🤖:
- Get a taste of machine learning concepts. It’s not mandatory but can be a huge plus! 🤓🤖
7. Projects, Projects, Projects! 🚀:
- Apply your skills to real-world projects. It’s the best way to learn and showcase your abilities! 🌐💻
8. Networking is Key 👥:
- Connect with fellow data enthusiasts on LinkedIn, attend meetups, and join relevant communities. Networking opens doors! 🌐👋
9. Certifications 📜:
- Consider getting certified. It adds credibility to your profile. 🎓💼
10. Stay Updated 🔄:
- The data world evolves fast. Keep learning and stay up-to-date with the latest trends and technologies. 📆🚀
. . .
#programming#programmers#developers#mobiledeveloper#softwaredeveloper#devlife#coding.#setup#icelatte#iceamericano#data analyst road map#data scientist#data#big data#data engineer#data management#machinelearning#technology#data analytics#Instagram
8 notes
·
View notes
Text
!!!! PLEASE REBLOG !!!!!
Hey, could y'all maybe take my little survey? it's for my capstone :) Tell me about your favorite character :)
#surveys#capstone#data science#data scientist#data science bootcamp#fandom#fandom things#fandom culture
4 notes
·
View notes
Text
reblogs appreciated :-)
24 notes
·
View notes